Summarizing system call activity on Solaris hosts
This article was posted by Matty on 2012-07-21 09:35:00 -0400 -0400
I previously described how to use strace to to summarize system call activity on Linux hosts. Solaris provides similar data with the truss “-c” option:
$ truss -c -p 26396
syscall seconds calls errors
read .000 3
write 7.671 25038
time .000 21
stat .000 15
lseek .460 24944
getpid .000 15
kill .162 7664
sigaction .004 237
writev .000 3
lwp_sigmask .897 49887
pollsys .476 7667
-------- ------ ----
sys totals: 9.674 115494 0
usr time: 2.250
elapsed: 180.940
The output contains the total elapsed time, a breakdown of user and system time, the number of errors that occurred, the number of times each system call was invoked and the total accrued time for each system call. This has numerous uses, and allows you to easily see how a process is intereacting with the kernel. Sweet!
Summarizing system call activity on Linux systems
This article was posted by Matty on 2012-07-20 18:19:00 -0400 -0400
Linux has a guadzillion debugging utilities available. One of my favorite tools for debugging problems is strace, which allows you to observe the system calls a process is making in realtime. Strace also has a “-c” option to summarize system call activity:
$ strace -c -p 28009
Process 28009 attached
Process 28009 detached
% time seconds usecs/call calls errors syscall
------ ----------- ----------- --------- --------- ----------------
78.17 0.001278 2 643 select
14.80 0.000242 1 322 read
7.03 0.000115 0 322 write
------ ----------- ----------- --------- --------- ----------------
100.00 0.001635 1287 total
The output contains the percentage of time spent in each system call, the total time in seconds, the microseconds per call, the total number of calls, a count of the number of errors and the type of system call that was made. This output has numerous uses, and is a great way to observe how a process is interacting with the kernel. Good stuff!
Installing OpenSSH on an AIX 7.1 server
This article was posted by Matty on 2012-07-15 09:42:00 -0400 -0400
I’m pretty new to AIX, and I’m learning all about its idiosyncrasies. One thing I still don’t understang is why SSH isn’t installed by default. The packages are located on the AIX 7 Volume 1 of 2 DVD, but for some reason the installer doesn’t feel the need to make sshd available to the system at install time. For those who care about security, the following steps will get SSH installed and operational on your AIX 7.1 server:
First, mount the “AIX 7 Volume 1 of 2” DVD in your drive (NIM installs aren’t covered here) and mount it up:
$ mount -V cdrfs -o ro /dev/cd0 /mnt
Once you mount the DVD you will need to change to the package directory:
$ cd /mnt/usr/sys/inst.images/
From there you can install the openssh and openssl packages:
$ installp -ac -Y -d . openssh.base openssl.base openssl.man.en_US openssh.man.en_US
This will install the packages and enable the SSH service. You can verify that the daemon started with the lssrc command:
$ lssrc -s sshd
Subsystem Group PID Status
sshd ssh 7340084 active
This is crazy simple and a great way to improve security on your AIX system.
Scalable storage for QEMU/KVM
This article was posted by Matty on 2012-07-12 13:33:00 -0400 -0400
While reading up on various scalable file systems I came across the sheepdog project. For those new to sheepdog, their website describes it as:
“Sheepdog is a distributed storage system for QEMU/KVM. It provides highly available block level storage volumes that can be attached to QEMU/KVM virtual machines. Sheepdog scales to several hundreds nodes, and supports advanced volume management features such as snapshot, cloning, and thin provisioning.”
This looks really cool, and I’m hoping to play around with it this weekend. Curious what experiences my readers have had with it?
Visualizing syslog data with LogAnalyzer and rsyslog-mysql
This article was posted by Matty on 2012-07-12 13:26:00 -0400 -0400
I recently discussed setting up rsyslog to write syslog data to a MySQL database. Once you get this set up, you can start writing SQL statements to view the data in various ways. The next logical step is visualizing your data, and that’s where LogAnalyzer comes in.
LogAnalyzer is a PHP application that can be used to visualize syslog data. You can use the main LogAnalyzer screen to view syslog data from all of your hosts as it is generated (this is handy). You can also invoke any number of searches against the data and view the results in a web browser. Pretty cool, ey? Setting up LogAnalyzer is crazy easy. First, you will need to grab the latest release from their website (I have been testing out the 3.5.0 beta):
$ wget http://download.adiscon.com/loganalyzer/loganalyzer-3.5.0.tar.gz
Once you have the tarball you will need to extract it and copy the “src” directory to a location accessible by your PHP-enabled web server:
$ tar xfvz loganalyzer-3.5.0.tar.gz
$ cp -rp loganalyzer-3.5.0/src /var/www/html/log
Next you will need to create an empty config.php file that is writeable by the web server. This can be accomplished with the configure.sh script:
$ cp loganalyzer-3.5.0/contrib/configure.sh /var/www/html/log
$ cd /var/www/html/log && ./configure.sh
The configure script creates a config.php file and changes the permissions to 666. You will definitely want to tighten up these permissions once the server is configured. If everything went smoothly you should be able to connect to your web server and run through the configuration screens. The first screen welcomes you and asks you to click “here” to continue the setup process:

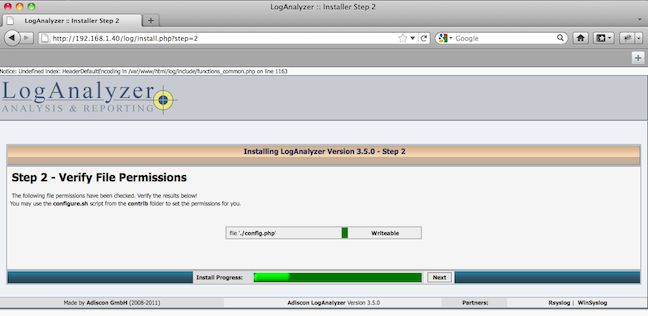
The second screen verifies that the config.php was created and has the correct permissions:

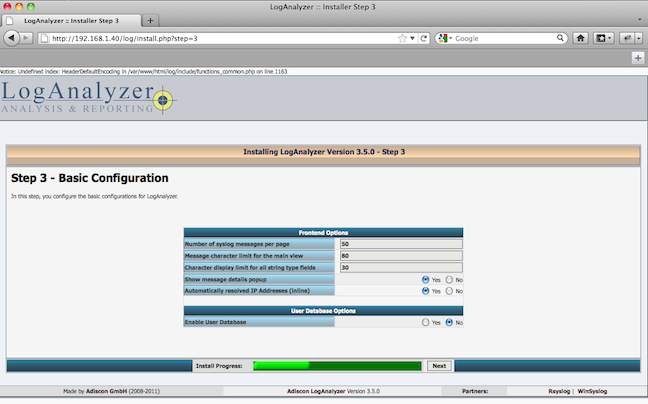
The next screen allows you to adjust the number of syslog entries that are displayed, the maximum size of the message to display and allows you to store the configuration in a MySQL database. I used the defaults, which have worked out ok so far:

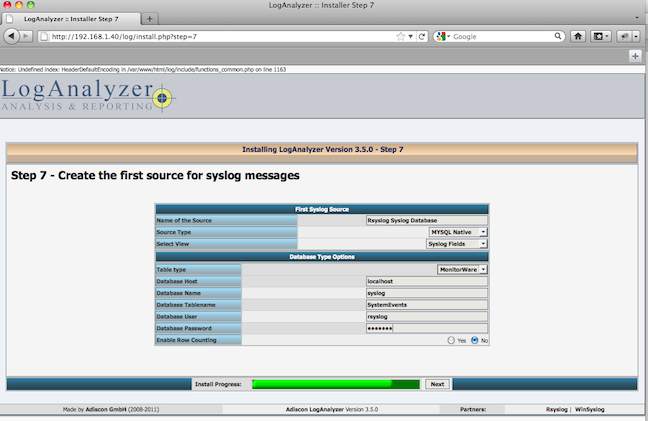
The last screen is used to input the MySQL database parameters. This includes the type of driver to use, the format of the SQL tables, the name of the server to connect to, the database to access and the user and password to connect with:

If everything completed correctly you should be able to access the main screen and begin viewing your syslog data:

On the main page you can view your logs in realtime and execute searches to pull up specific syslog data. LogAnalyzer allow has a “Statistics” page that allows you to view the number of syslog events by host, the number of messages by the entity generating them and the number of messages generated by date. Searches allow you to search by tag and value, and I’m still trying to figure out if you can use regular expressions or logical operations to limit values. More to come on this in a future post.