I recently discussed setting up rsyslog to write syslog data to a MySQL database. Once you get this set up, you can start writing SQL statements to view the data in various ways. The next logical step is visualizing your data, and that’s where LogAnalyzer comes in.
LogAnalyzer is a PHP application that can be used to visualize syslog data. You can use the main LogAnalyzer screen to view syslog data from all of your hosts as it is generated (this is handy). You can also invoke any number of searches against the data and view the results in a web browser. Pretty cool, ey? Setting up LogAnalyzer is crazy easy. First, you will need to grab the latest release from their website (I have been testing out the 3.5.0 beta):
$ wget http://download.adiscon.com/loganalyzer/loganalyzer-3.5.0.tar.gz
Once you have the tarball you will need to extract it and copy the “src” directory to a location accessible by your PHP-enabled web server:
$ tar xfvz loganalyzer-3.5.0.tar.gz
$ cp -rp loganalyzer-3.5.0/src /var/www/html/log
Next you will need to create an empty config.php file that is writeable by the web server. This can be accomplished with the configure.sh script:
$ cp loganalyzer-3.5.0/contrib/configure.sh /var/www/html/log
$ cd /var/www/html/log && ./configure.sh
The configure script creates a config.php file and changes the permissions to 666. You will definitely want to tighten up these permissions once the server is configured. If everything went smoothly you should be able to connect to your web server and run through the configuration screens. The first screen welcomes you and asks you to click “here” to continue the setup process:

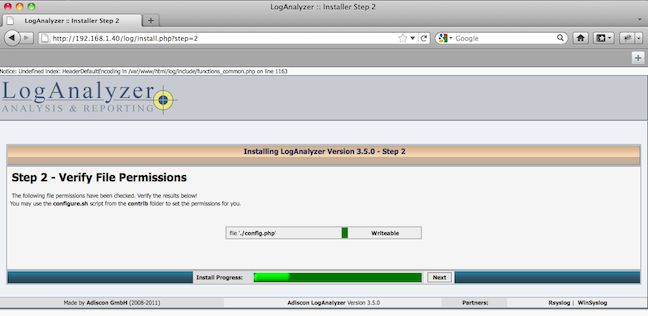
The second screen verifies that the config.php was created and has the correct permissions:

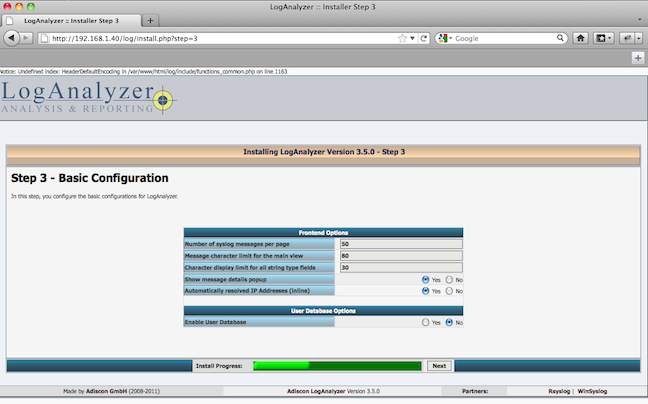
The next screen allows you to adjust the number of syslog entries that are displayed, the maximum size of the message to display and allows you to store the configuration in a MySQL database. I used the defaults, which have worked out ok so far:

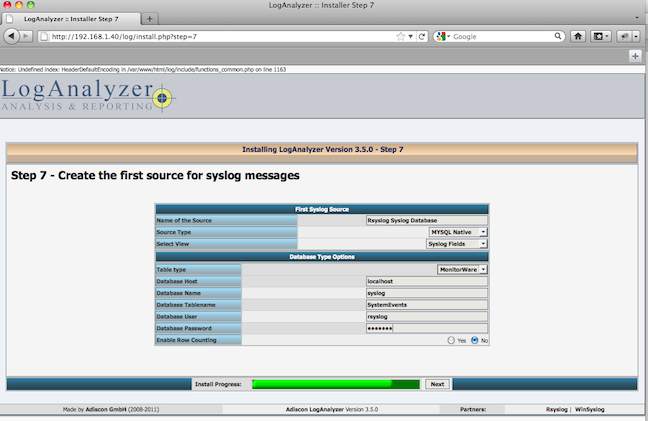
The last screen is used to input the MySQL database parameters. This includes the type of driver to use, the format of the SQL tables, the name of the server to connect to, the database to access and the user and password to connect with:

If everything completed correctly you should be able to access the main screen and begin viewing your syslog data:

On the main page you can view your logs in realtime and execute searches to pull up specific syslog data. LogAnalyzer allow has a “Statistics” page that allows you to view the number of syslog events by host, the number of messages by the entity generating them and the number of messages generated by date. Searches allow you to search by tag and value, and I’m still trying to figure out if you can use regular expressions or logical operations to limit values. More to come on this in a future post.